The AI analytics platform
built for sharp, shared decisions
Align notebooks, metrics, and apps in one clean workspace so anyone can move from question to insight with confidence.
What Data Ops Does
Turn data into reports, analytics, and patterns you can act on
Use notebooks to explore, AI agents to summarize, and interactive apps to share insights. The result: faster decisions, fewer blind spots, and clarity across your team.
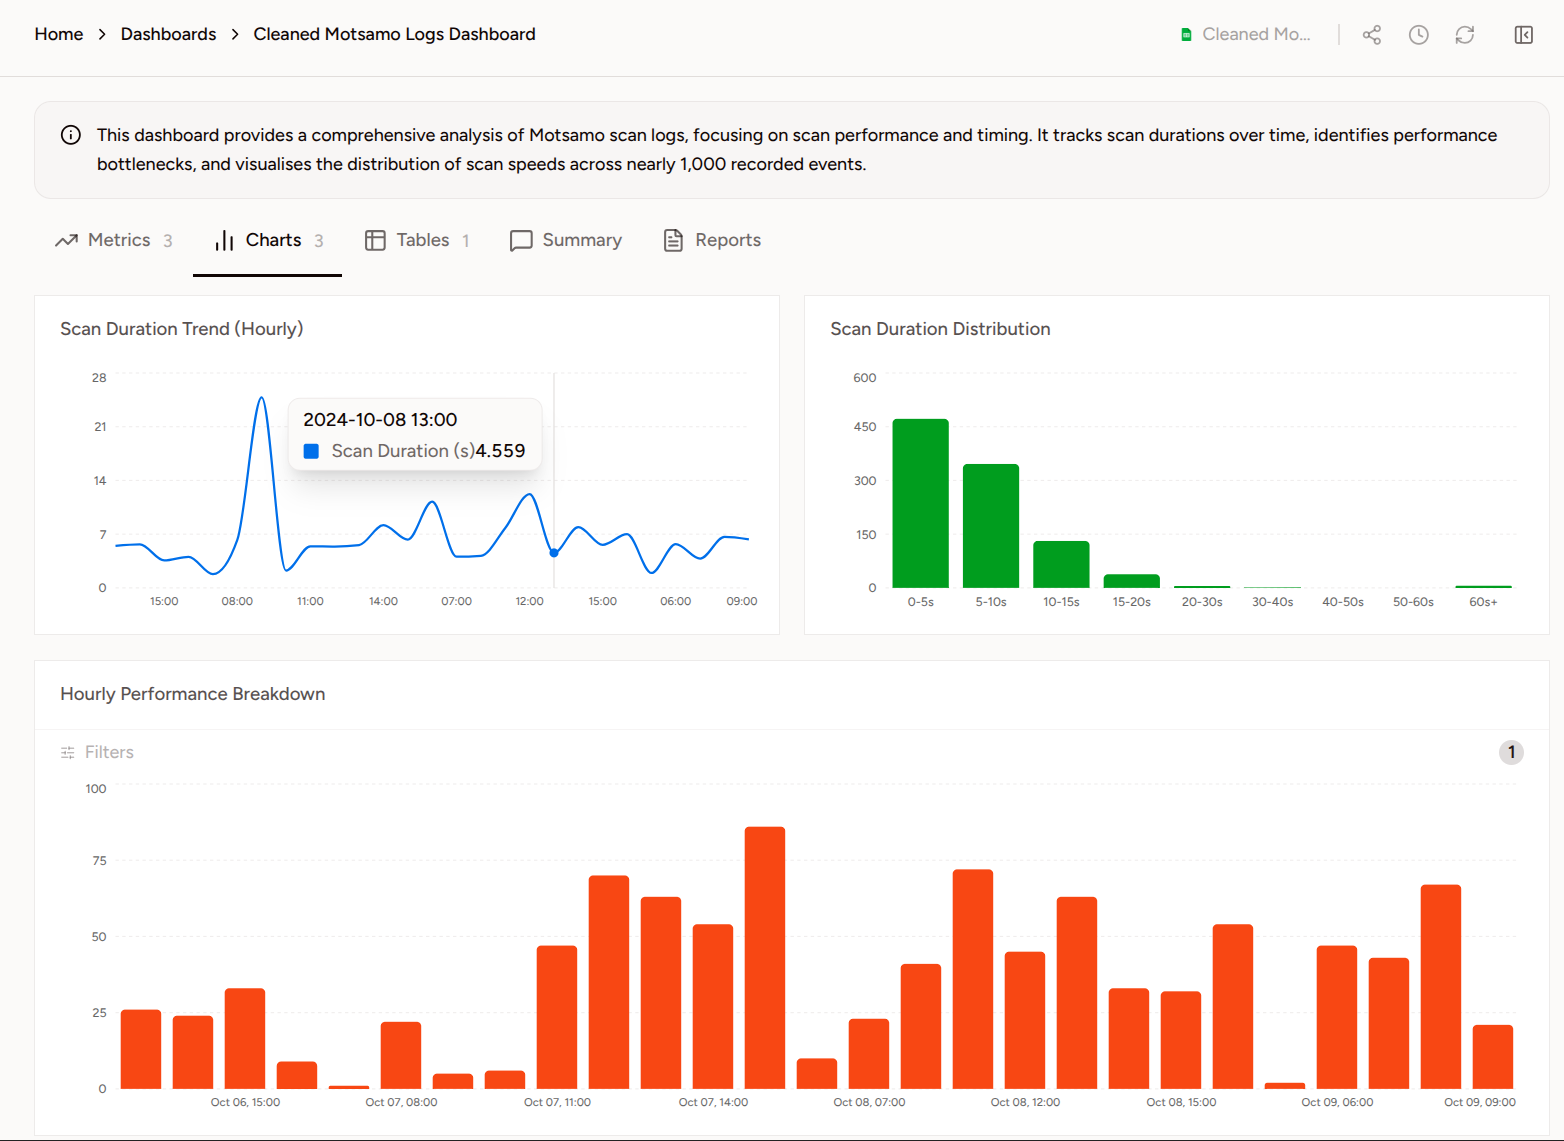
Dashboard Builder
Building your dashboard like lego bricks, with the data that matters to you.
Everything in one place
Built for the full analytics lifecycle
From raw data to shareable dashboards — DataOps handles every step so your team can stay focused on the insight, not the infrastructure.
01
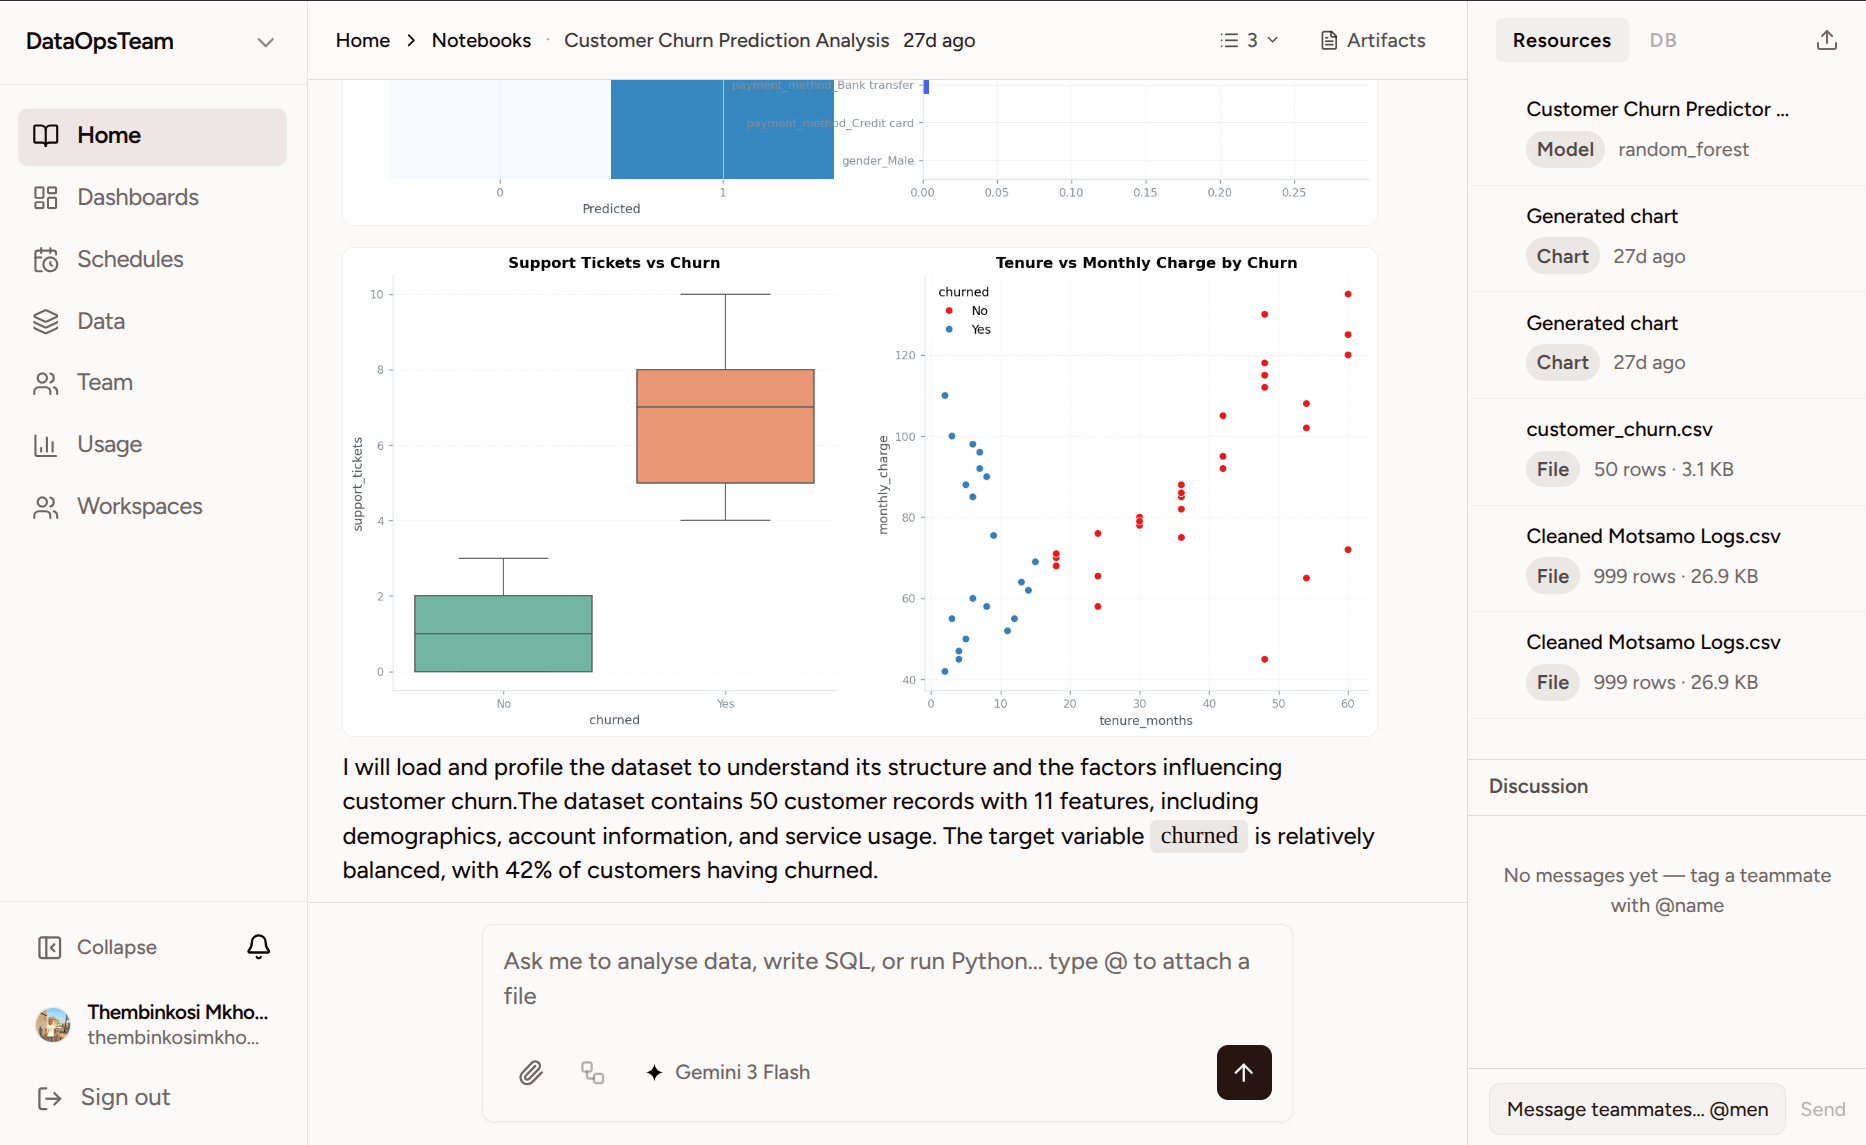
AI Notebooks
Chat with your data. The agent writes Python, runs it in a sandbox, and renders charts — all in a single thread.
02
Session Memory
The agent remembers domain facts, metric definitions, and recurring patterns across every session.
03
Anomaly Alerts
Every uploaded CSV is scanned automatically. Outliers, missing-value spikes, and schema drifts surface as instant notifications.
04
Scheduled Runs
Set any panel on a cron schedule. Get email or in-app alerts when a metric crosses your threshold.